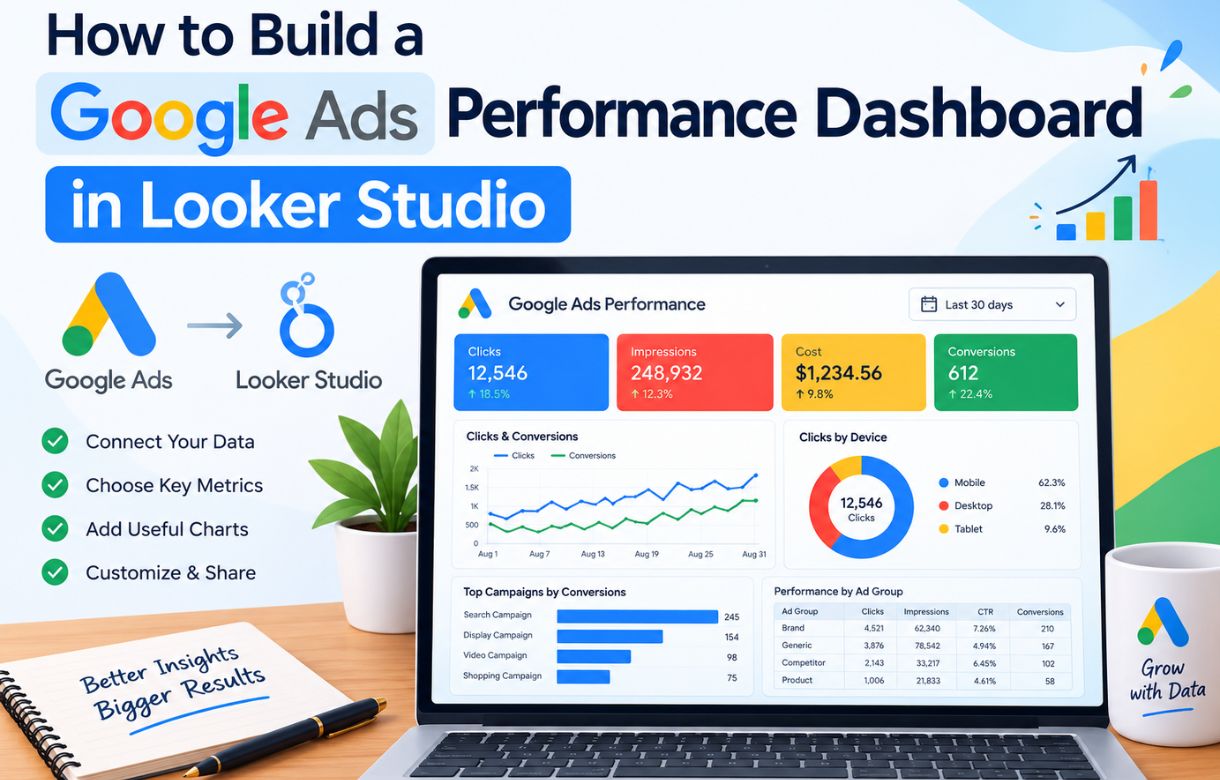
Google Ads’ own interface is fine for daily campaign management, but it’s a poor place to actually understand performance. Every number is buried a few clicks deep, date comparisons require rebuilding the same filter every time, and if you manage more than one account, you’re switching contexts constantly just to see the full picture.
I went through the same frustration with Search Console before I built out a proper Looker Studio dashboard for SEO reporting, and Google Ads has the exact same fix available. This post walks through connecting Google Ads to Looker Studio and building a dashboard you’ll actually open, rather than one you build once and forget.
What do you need before starting?
An active Google Ads account with some campaign history, and a Google account with access to both Google Ads and Looker Studio — typically the same login works for both, provided you have at least viewer-level access to the ad account.
If you’re brand new to Looker Studio entirely and want the gentler version of this same connection process first, I covered the Search Console equivalent in detail, and the Google Ads connector works almost identically — same report-building interface, just a different data source underneath.
How do you connect Google Ads to Looker Studio?
Step 1: Start a new report
Open Looker Studio, sign in with the account tied to your Google Ads access, click Create, then Report. This opens a blank canvas and immediately prompts you for a data source.
Step 2: Choose the Google Ads connector
Search for Google Ads in the connector list. It’s a native Google connector, so no third-party app or additional authorization step beyond your normal Google login is required.
Step 3: Select the right account level
This is the step that trips people up most. If you manage a single standalone account, select it directly. If your Google Ads account sits under an MCC (manager account) — common for agencies or anyone managing multiple clients — you’ll need to select the specific sub-account, not the MCC itself, unless you specifically want blended data across every account under it. Selecting the wrong level here is the single most common reason a first dashboard shows nothing useful, or shows numbers that don’t match what you expected.
Step 4: Add the connection
Click Add, then confirm when prompted. Your account’s data should populate within a few seconds as a default table.
Step 5: Build your core charts
This is where the dashboard actually takes shape. Start with a time-series chart plotting Cost, Clicks, and Conversions together over your chosen date range. Seeing spend and results on the same timeline, rather than as separate numbers, is what turns raw data into an actual read on performance.
Step 6: Add a campaign-level breakdown table
Pull in Campaign as your dimension, with Cost, Clicks, Conversions, and Cost per Conversion as metrics, sorted by cost descending. This single table answers the question you’ll come back to most: which campaigns are actually earning their spend, and which ones are burning budget without results.
Step 7: Set up a date comparison control
Add Looker Studio’s built-in date range comparison so you can toggle between “this month vs last month” without rebuilding filters each time. A cost-per-conversion number on its own tells you less than the same number shown against its trend.
Step 8: Save and bookmark it
The report saves automatically. Bookmark it somewhere you’ll genuinely revisit — the entire value of this exercise disappears if it becomes another tab you built once and never open again.
What should actually be on a PPC dashboard, and what shouldn’t?
Keep it tight. The instinct with Google Ads data specifically is worse than with SEO data, because Ads offers so many segment options — device, time of day, audience, demographics, ad group, keyword match type — that it’s easy to build twelve charts because the data exists, not because you need it.
What earns a spot: spend vs. conversions over time, cost per conversion by campaign, and click-through rate by ad group if you’re actively testing ad copy. That’s close to the full list for most accounts.
What usually doesn’t: device and demographic breakdowns, unless you have a specific active question they answer (for example, you’re deciding whether to adjust mobile bid modifiers). Keyword-level data for every single keyword in the account is almost always too granular for a dashboard — that level of detail belongs in Google Ads’ own search terms report when you’re actively optimizing, not in a dashboard you glance at weekly.
Why build this in Looker Studio instead of just using Google Ads’ own reports?
Google Ads’ native reporting is genuinely capable, but it’s built for single-account, in-the-moment analysis, not for a recurring view you check on your own schedule. A few specific advantages Looker Studio has over staying inside Google Ads directly:
Cross-account views, if you manage more than one. Google Ads’ interface makes comparing two separate accounts side by side awkward. Looker Studio can blend or display multiple account connections in a single report.
Saved, consistent formatting. Every time you open Google Ads, you’re looking at whatever the interface defaults to. A Looker Studio report keeps your exact chart setup, filters, and date comparisons exactly as you left them.
Sharing without giving account access. If you want a client or a colleague to see performance without handing them actual Google Ads account access, a shared Looker Studio link does that cleanly.
How do you handle multiple Google Ads accounts in one dashboard?
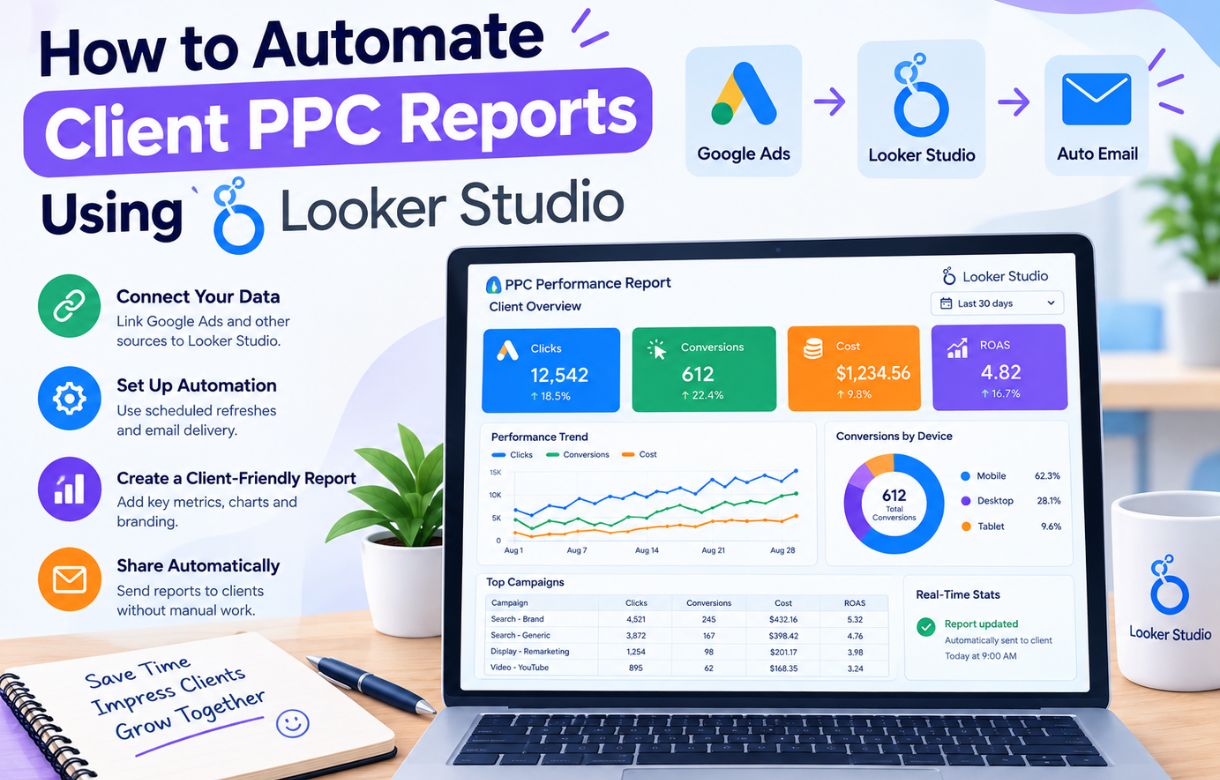
Add each account as a separate connected data source within the same report, rather than trying to force them into one blended table immediately. For a quick side-by-side comparison, a single table with Account Name as a dimension works well once you’ve connected more than one source. For anything more involved — recurring reports across several client accounts — that’s a deliberate setup of its own, and it’s exactly what I cover in How to Automate Client PPC Reports Using Looker Studio, including the scheduling piece that saves you from manually refreshing and exporting reports every month.
What if I’d rather start from a pre-built dashboard instead of building from scratch?
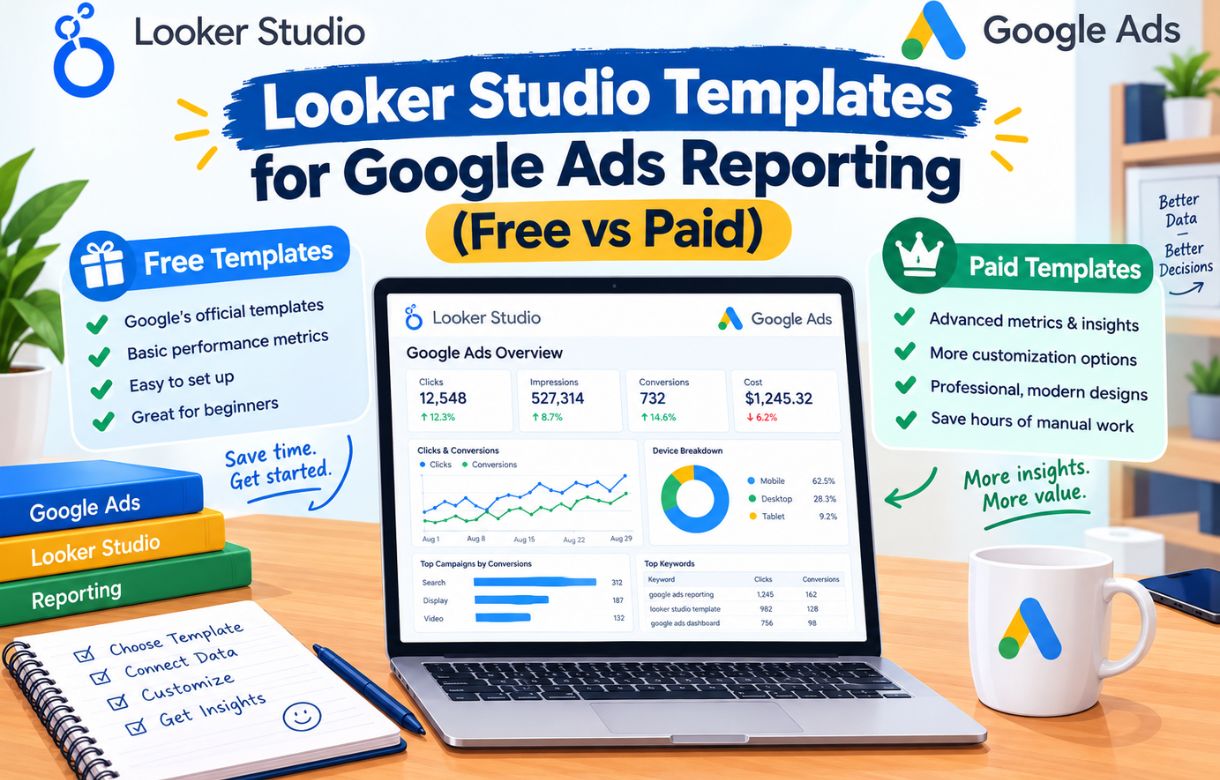
That’s a reasonable shortcut, especially if you manage several accounts and don’t want to rebuild the same chart setup each time. I compared the free and paid options worth considering in Looker Studio Templates for Google Ads Reporting (Free vs Paid) — some genuinely save setup time, and some aren’t worth the cost over building it yourself the way this post walks through.
What commonly goes wrong when connecting Google Ads data?
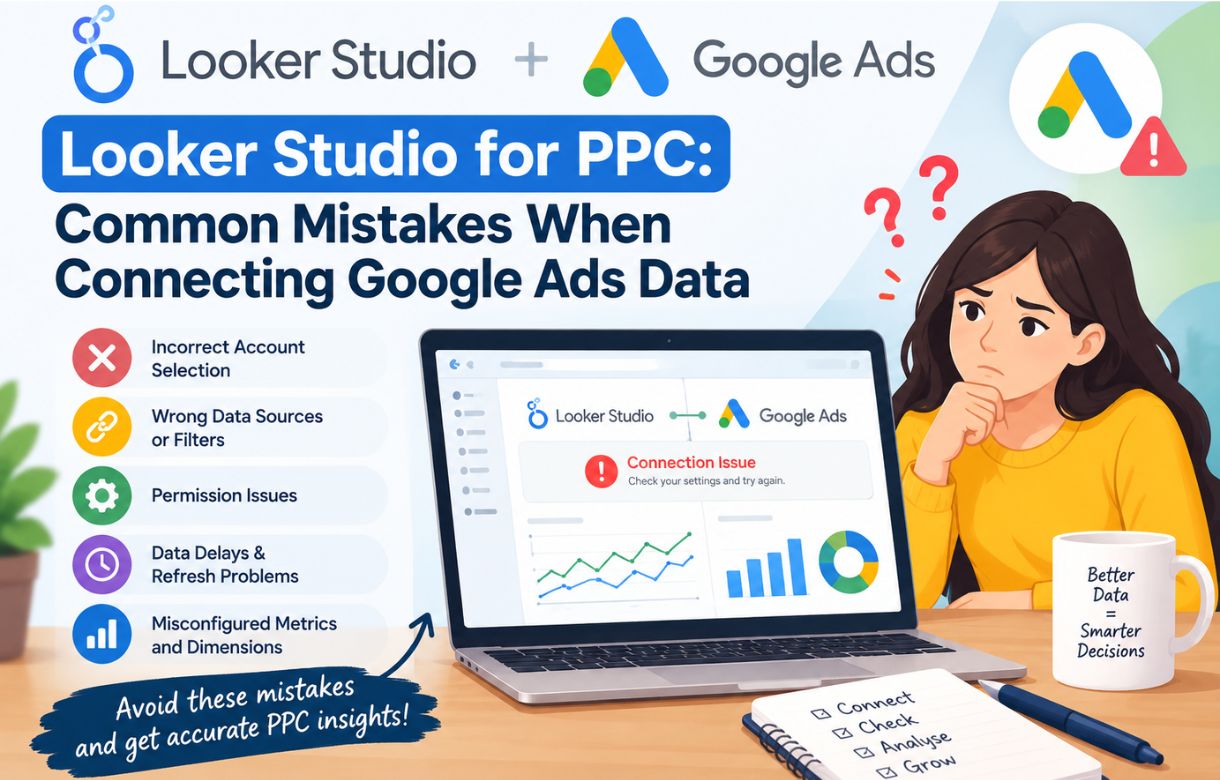
A surprising number of first-time Looker Studio dashboards show numbers that don’t match what the Google Ads interface itself reports, usually because of a currency mismatch across accounts, a date range misalignment, or confusion between account-level and MCC-level data. I put together a dedicated troubleshooting post for exactly this — Looker Studio for PPC: Common Mistakes When Connecting Google Ads Data — worth a look before you assume your dashboard is correct, since a silently wrong number is worse than an obviously broken chart.
How often should you actually check this dashboard?
Weekly is usually the right cadence for most accounts, with a deeper look at month-end when you’re evaluating whether to shift budget between campaigns. Checking daily tends to produce reactions to normal short-term noise rather than genuine trends — ad spend and conversion numbers fluctuate day to day for reasons that have nothing to do with campaign quality, and reacting to every small dip is a fast way to make changes you’ll undo a week later. Save the daily checking for an active campaign launch or a specific test you’re running, and let the dashboard do its job as a weekly or monthly check-in the rest of the time.
FAQ
Is the Google Ads connector in Looker Studio free?
Yes. Both Looker Studio itself and the native Google Ads connector are free, with no premium tier required for a standard account connection.
Can I see historical data from before I connected the account?
Yes, within Google Ads’ own data retention window, which is considerably longer than Search Console’s. Connecting the account for the first time doesn’t limit you to only new data going forward — your existing campaign history pulls in as well.
Do I need a Google Ads Manager (MCC) account to build this dashboard?
No. A standard, single Google Ads account connects directly to Looker Studio without needing an MCC structure. An MCC only becomes relevant if you’re managing multiple client accounts and want a consolidated view across them.
How often does the dashboard data refresh?
Looker Studio refreshes Google Ads data automatically, typically within a few hours of new activity, though the exact cadence can vary slightly. For same-day, real-time monitoring during an active campaign launch, the native Google Ads interface is still the more immediate source.
Will building this dashboard slow down my Google Ads account or affect campaigns?
No. Looker Studio only reads data from your account — it cannot modify bids, budgets, or campaign settings. It’s a completely separate, read-only reporting layer.