If you manage PPC for more than one or two clients, you already know the monthly ritual: pull numbers from each account, format them into something presentable, write a summary, and send it off before the client asks where their report is. Do that for five or ten accounts and it eats a meaningful chunk of every month, for work that adds very little strategic value — it’s assembly, not analysis.
Once you’ve built a performance dashboard in Looker Studio for a single account, the automation layer on top of it is what actually turns that into a scalable reporting system instead of a one-off dashboard you still manually screenshot every month.
What does “automated” actually mean here?
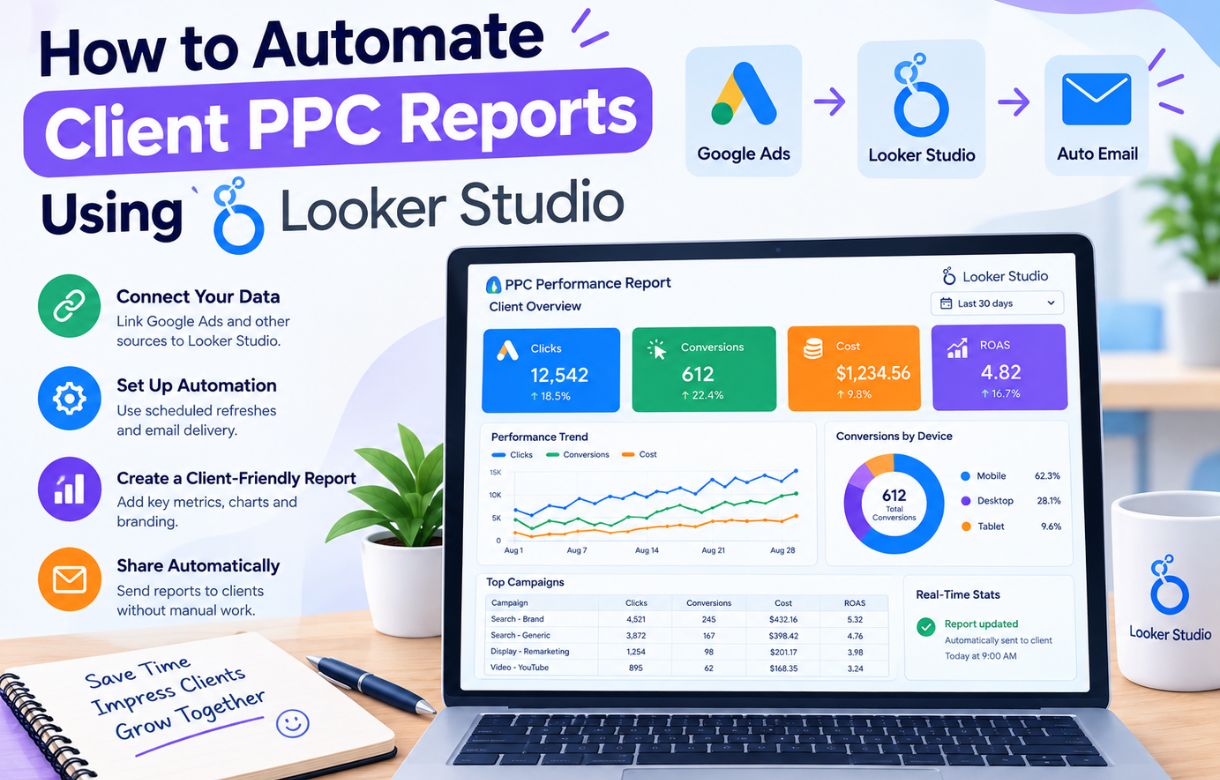
Two separate things, and it’s worth being specific. First, the dashboard itself updates automatically as new Google Ads data comes in — you’re not manually re-pulling numbers each time. Second, Looker Studio has a built-in scheduled email delivery feature that sends a PDF snapshot of the report to specified recipients on a recurring schedule, without you touching anything once it’s set up.
Combined, this means a client can receive a fresh, accurate report every month without you doing anything beyond the initial setup — which is the actual goal, not just having a nicer-looking dashboard.
How do you set up one dashboard per client?
Step 1: Decide between separate reports or one report with filters
For a small number of clients, building a completely separate Looker Studio report per client keeps things cleanly separated and avoids any risk of one client’s data being visible to another. For a larger roster, a single report with a client-selector filter is more maintainable, but requires careful permission management so each client only ever sees their own data when the link is shared.
For most freelancers and small agencies, I’d recommend separate reports per client, at least until the number of clients makes that genuinely unwieldy. The data-isolation guarantee is worth the extra setup time.
Step 2: Build the core dashboard once, then duplicate it
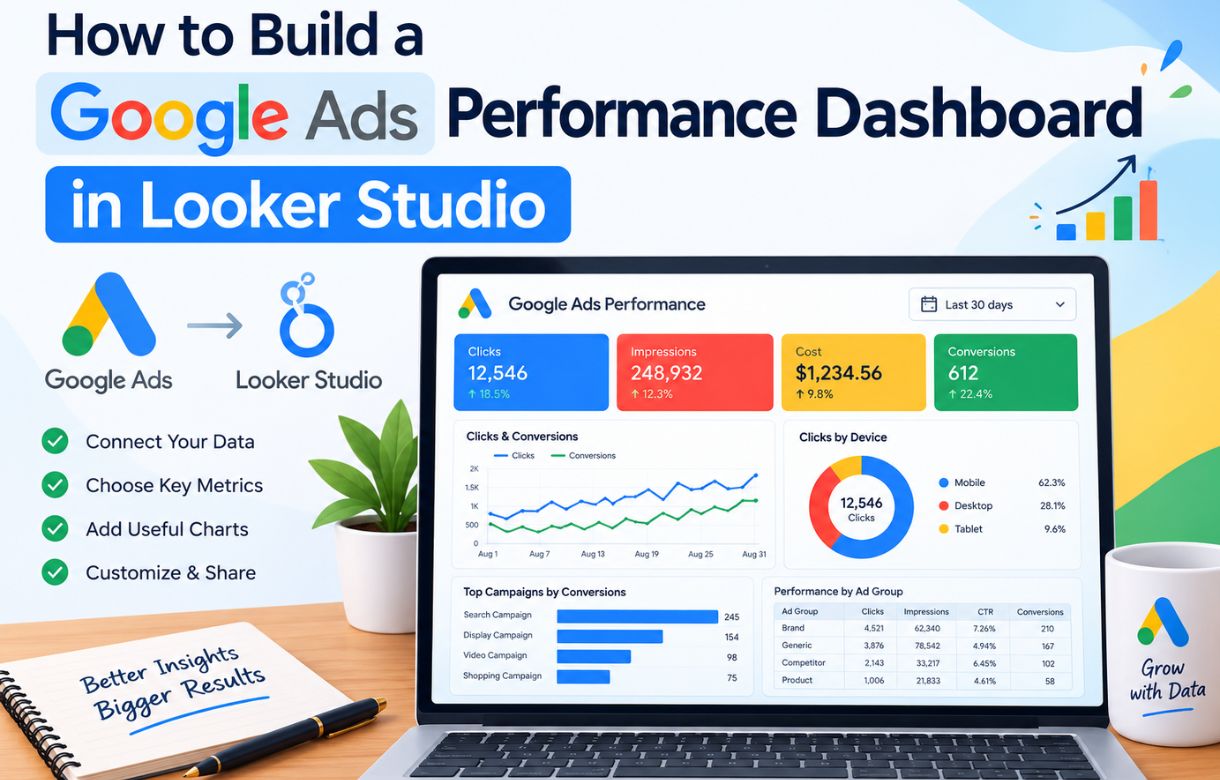
Build your standard dashboard structure for one client first — the same spend, clicks, conversions, and cost-per-conversion view covered in the performance dashboard guide. Once it’s right, use Looker Studio’s File > Make a copy option for each additional client, swapping the data source connection each time rather than rebuilding the chart layout from scratch.
This is where having a consistent template pays off directly — every client report looks and behaves the same way, which also makes it faster for you to scan across multiple client dashboards without re-learning a new layout each time.
Step 3: Set up the scheduled email delivery
In the report, click the Share menu and select Schedule email delivery. You’ll choose the recipient, frequency (weekly, monthly, or a custom schedule), and whether it’s delivered as a PDF snapshot or a link to the live report. For client reporting, I default to monthly PDF delivery — it reads as a clean, finished document, whereas a live link invites a client to poke around and ask questions about metrics outside the scope of what you actually want to discuss with them.
Step 4: Add a summary text box for context
A raw dashboard without commentary tends to generate more client questions than it answers. Add a small text element at the top of the report — even a few sentences — noting anything unusual in the period (a seasonal dip, a campaign pause, a test you ran). This doesn’t need to be rebuilt every month if the dashboard structure stays consistent; just update the text box briefly before the scheduled send goes out, or build it into your monthly routine as a two-minute task rather than skipping it entirely.
Step 5: Test the scheduled delivery before relying on it
Send yourself a test copy first, checking that the data populates correctly, the date range is set the way you intend (not accidentally frozen on the date you built it), and the PDF formatting actually looks client-ready rather than cut off or misaligned. This step catches the kind of embarrassing mistake — a chart that renders broken in PDF export, even though it looked fine in the live editor — that’s much better caught by you than by a client.
How do you handle multiple ad accounts under one agency setup?
If you’re managing accounts through a Google Ads Manager (MCC) account, each client’s account still connects to Looker Studio as its own distinct data source — the MCC structure doesn’t automatically blend them for you, and you generally don’t want it to for individual client reports anyway, since mixing client data into one report defeats the purpose of per-client reporting.
Where an MCC structure helps is on the agency side: a separate internal dashboard, not shared with any client, that blends data across all managed accounts so you can see overall agency performance at a glance. That’s a genuinely different report from anything a client should see, and it’s worth keeping clearly separate rather than trying to build one dashboard that serves both purposes.
What goes wrong most often with this setup?
Forgetting to update the date range before the first send. If you build the dashboard with a fixed date range instead of a rolling one (like “last 30 days”), the scheduled email keeps sending the same static period every time instead of updating. Always use a rolling date range for anything on a recurring schedule.
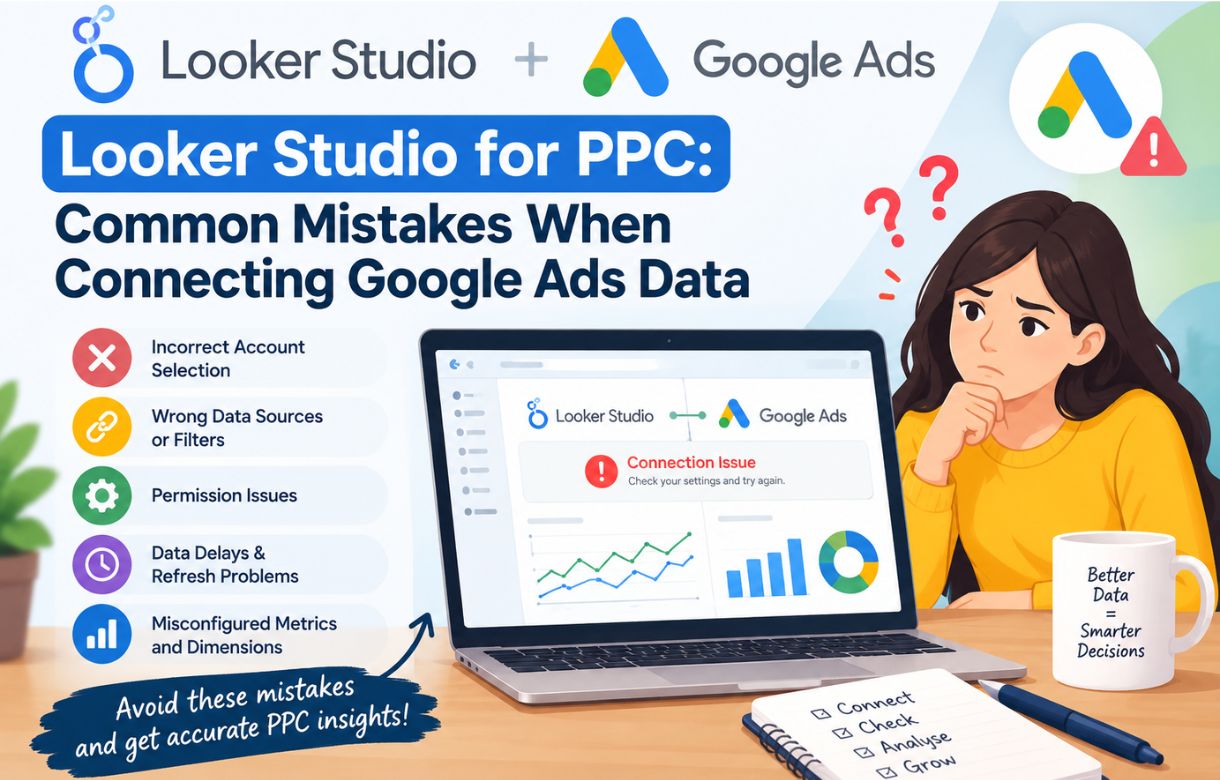
Currency and account-level mismatches, especially if you manage clients in different countries or currencies. A blended or misconfigured connection can silently show the wrong currency symbol or mix numbers in ways that look plausible but aren’t accurate — this is common enough that I wrote a dedicated post on it, Looker Studio for PPC: Common Mistakes When Connecting Google Ads Data, worth checking before you roll this out across several client accounts.
Over-automating the human part. The scheduled email covers the data; it doesn’t cover the judgment a client is often actually paying for. A report that lands in their inbox with zero commentary can read as impersonal, even if the data itself is perfect. The few minutes it takes to add context each month is usually worth more to client retention than the automation itself.
Is a paid template worth it for agency-scale reporting?
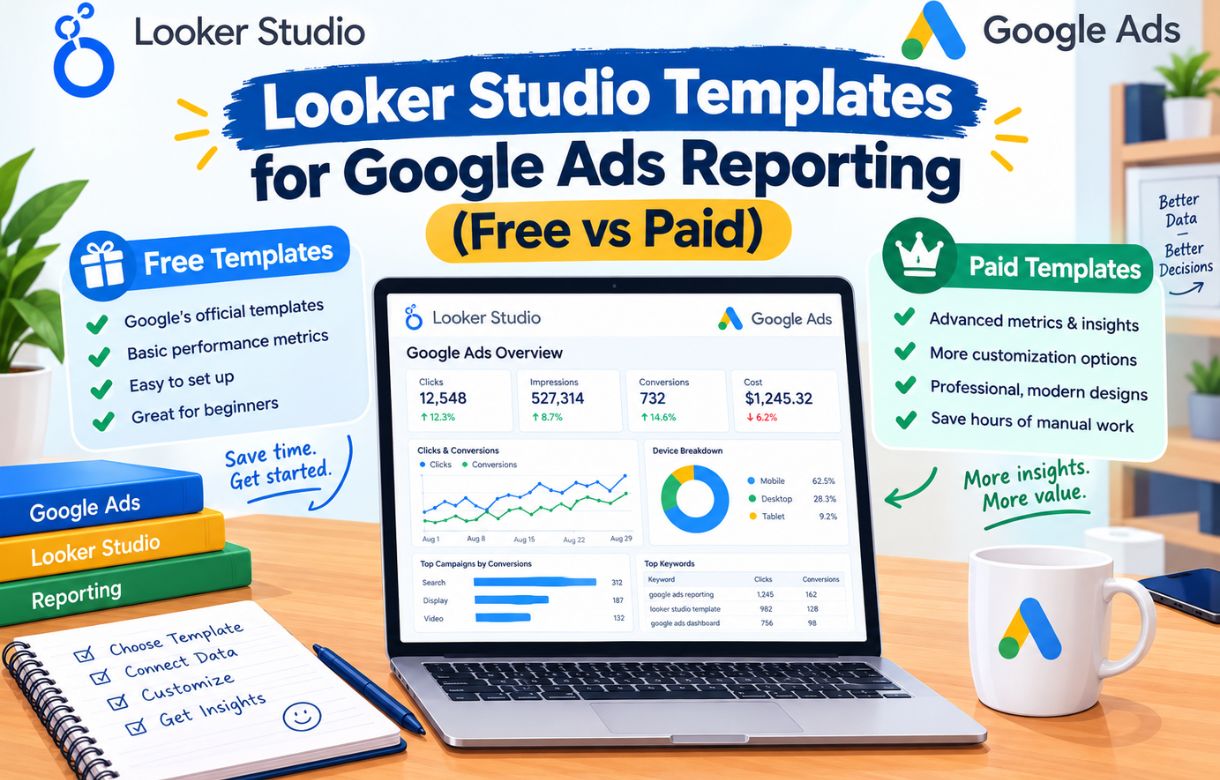
Often, yes, more so here than for a single-account setup. If you’re managing five or more client accounts, a well-built paid template designed specifically for multi-client agency reporting can save real setup time, particularly around consistent client-facing polish and pre-solved per-account filtering. I weighed the free-versus-paid decision in more detail in Looker Studio Templates for Google Ads Reporting (Free vs Paid), and the agency-scale case is where paying tends to make the most sense.
What if the same clients also want SEO reporting?
Many freelancers and small agencies end up reporting on both channels for the same client, and the same automation setup extends naturally to Search Console data. If you haven’t connected it yet, I walk through the full process in How to Connect Google Search Console to Looker Studio, and the scheduling steps above work identically once that source is in the report.
The bigger risk when you add a second channel is clutter, not setup difficulty. A client report that crams every Ads and Search Console metric onto one page stops being readable fast, which is why I’d keep the SEO side to the same three views I describe in Looker Studio SEO Dashboard: What Metrics Actually Matter.
If a client specifically asks about keyword movement, How to Track Keyword Rankings in Looker Studio Without Paying for Ahrefs/Semrush covers a free way to add that view without buying a separate rank-tracking tool for every account.
How much time does this actually save?
For a handful of clients, the time savings are modest but real — maybe an hour or two a month. At agency scale, with ten or more client accounts on a monthly reporting cycle, the difference between manual exports and a properly automated Looker Studio setup can be the difference between reporting eating a full day each month and barely touching your calendar at all. The upfront setup cost is real, but it’s a one-time cost against a recurring monthly saving, which is exactly the kind of investment worth making early rather than continuing to manually assemble reports every month indefinitely.
FAQ
Can clients reply to or interact with the scheduled report email?
Not directly through Looker Studio’s delivery system — it’s a one-way scheduled send. If you want client interaction or questions, that typically happens through a separate email or call, with the automated report as the starting point for that conversation rather than a replacement for it.
What happens if a client’s Google Ads account access changes or gets revoked?
The scheduled report will stop updating or may show an error, since the connection relies on continued access to the underlying account. It’s worth periodically checking that all client connections are still active, especially after any account ownership changes.
Can I automate reports that combine Google Ads with other platforms, like Meta Ads?
Looker Studio supports connectors for several ad platforms, so a combined cross-platform report is possible, though each platform’s connector has its own quirks and field structures to account for. Starting with Google Ads alone and adding a second platform once that’s solid is the more manageable approach.
Is there a limit to how many scheduled email reports I can set up?
Looker Studio doesn’t impose a specific limit on the number of scheduled deliveries tied to your account, though managing a very large number of separate client reports becomes more of an organizational challenge than a technical one as your client roster grows.