Ahrefs and Semrush both do proper rank tracking — daily SERP snapshots, competitor comparisons, the works. They’re also $99+ a month before you’ve published a single extra article. For a solo blogger watching a handful of target keywords, that’s a hard cost to justify early on.
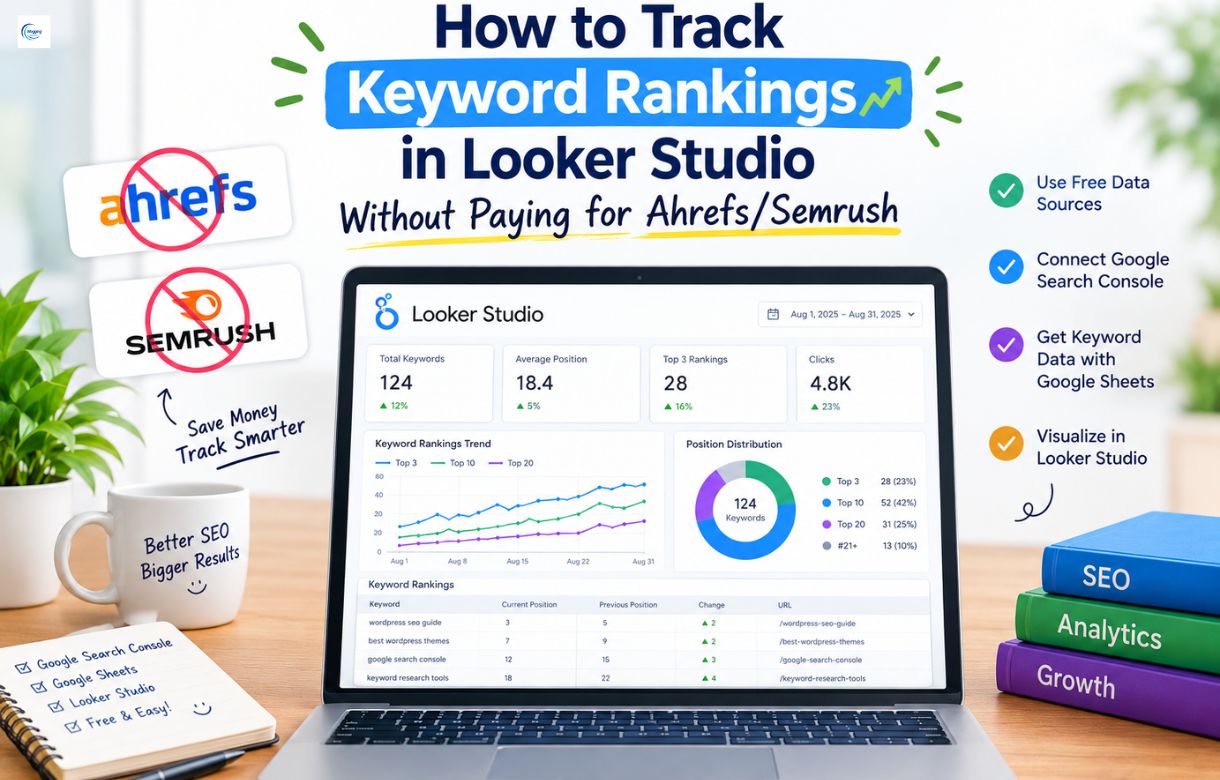
Search Console already has the position data. It’s just sitting inside its own limited interface, buried under weeks of Performance report clicks. If you’ve already connected Search Console to Looker Studio, you can turn that same data into a workable, free keyword-tracking view. Here’s exactly how.
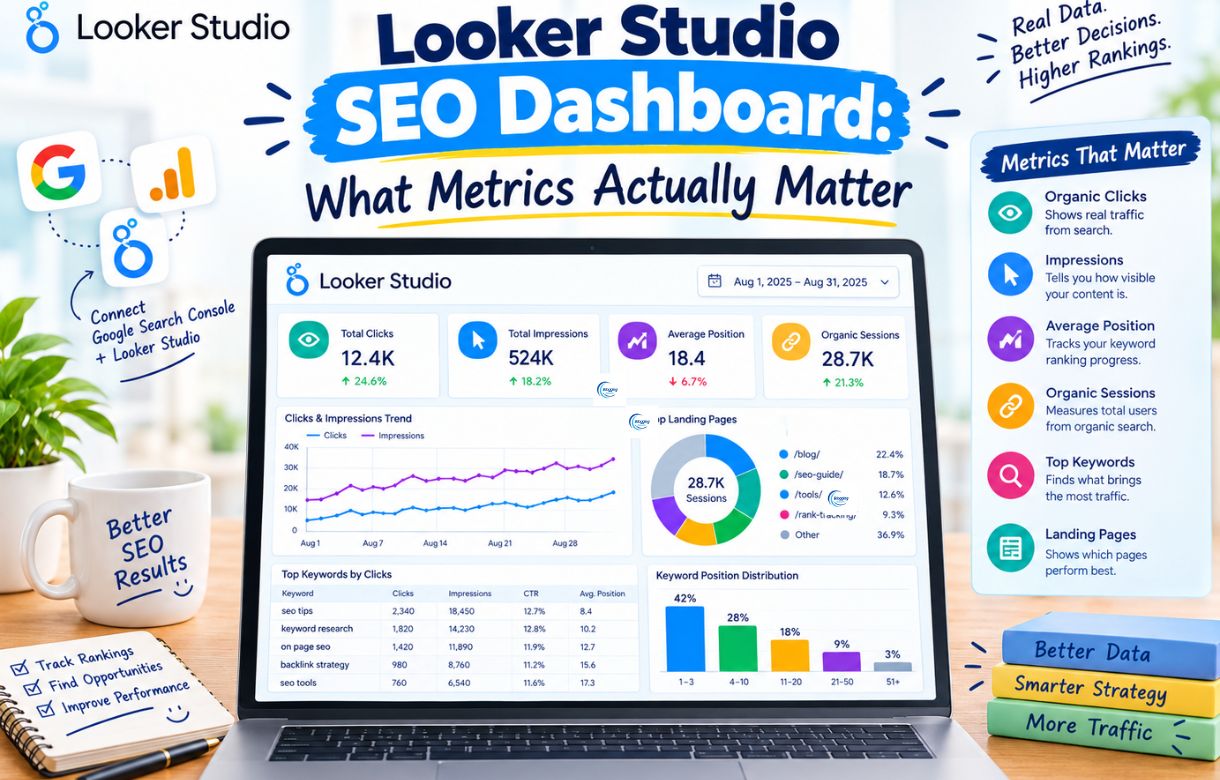
This is a deliberately narrow, mechanical build — if you haven’t settled on your dashboard’s core view yet, Looker Studio SEO Dashboard: What Metrics Actually Matter covers that groundwork first. This post picks up from there, specifically for tracking individual keywords.
Can Search Console actually replace a rank tracker?
Not fully, and it’s worth being upfront about the gap before you build this. Search Console gives you average position — an average across every search that triggered an impression for that query, not a single daily SERP snapshot. A dedicated rank tracker checks your position for a keyword once a day, cleanly. Search Console’s number can bounce around based on device, location, and how the query was phrased.
What it does give you, for free, is a directionally accurate trend over time for the keywords you actually care about — which is usually enough for a small site deciding whether a page is moving up, holding steady, or sliding.
How do you set up keyword-level rank tracking in Looker Studio?
Step 1: Filter your Looker Studio table to Query data
If you followed the original connection setup, you likely chose URL Impressions as your data type. For this, add a second table to your report, or filter your existing chart’s dimension to Query instead of Landing Page. This switches the view from “which pages” to “which search terms.”
Step 2: Add a filter for your target keywords
Click the table, open its filter settings, and add a filter rule where Query contains the specific keyword or phrase you’re tracking. If you’re watching five or six target keywords, you can either build one filter per keyword as separate charts, or use “contains one of” logic to group a few related terms into a single view.
This step is what turns a noisy, all-queries table into an actual tracking list — without it, you’re looking at hundreds of rows for keywords bringing in a single impression.
Step 3: Add Position and Date as fields
With your filter applied, pull in Average Position as the metric and Date as your dimension, displayed as a line chart. This gives you a visual trend line for that specific keyword’s position over time, instead of a single static number.
Step 4: Set a rolling date comparison
Use Looker Studio’s built-in date range comparison feature to compare the current period against the previous one (last 28 days vs. the 28 days before that, for example). This turns “position 14” into “position 14, up from position 22” — the actual useful signal, since a single position number without a trend tells you very little.
Step 5: Duplicate the setup per keyword
Copy the chart and swap the filter for your next target keyword. Five or six of these stacked on one page gives you a genuinely useful, free rank-tracking view, refreshed automatically every time you open it.
What are the real limitations of this method?
No true daily snapshot. You’re working with Search Console’s rolling averages, not a clean daily position check. Sudden single-day ranking swings won’t show up the way they would in a dedicated tool.
No competitor data. This method tells you where you rank. It tells you nothing about who’s above you or why. If competitive analysis matters for your niche, this doesn’t replace that half of what a paid tool does.
Query matching isn’t exact. Search Console groups and anonymizes some low-volume queries, so a keyword with very little search volume might not show clean data even if you’re technically ranking for it.
For a site still building its keyword footprint, none of these gaps tend to matter much day-to-day. They matter more once you’re managing a large keyword portfolio or competing in a genuinely crowded niche — at that point, a paid tool starts earning its cost.
FAQ
Does this work for keywords I’m not ranking for yet?
No. Search Console only reports data for queries where your site actually appeared in results at least once. If you want to research keywords you haven’t ranked for at all, that’s a separate keyword research step, not a tracking one.
How accurate is Search Console’s “average position” compared to an actual SERP check?
It’s a genuine average across all the searches, devices, and locations that triggered an impression for that query — which means it can differ meaningfully from what you personally see when you search the term yourself. Treat it as a trend indicator, not a precise daily rank.
Can I track rankings for keywords across multiple pages at once?
Yes. Add Landing Page as a secondary dimension alongside Query in the same chart, and you can see which specific page is ranking for a given keyword, which is useful if more than one page on your site is competing for the same term.
Is this a permanent replacement for a paid rank tracker?
For a small site with a handful of priority keywords, it can be enough long-term. Once you’re tracking dozens of terms across a competitive niche, or need daily precision and competitor comparisons, a dedicated paid tool starts doing work this method genuinely can’t.
What else should be on my Looker Studio SEO dashboard besides keyword tracking?
Keyword tracking is one deliberate addition, not the foundation. For the core view worth building first — and what to leave off it — see Looker Studio SEO Dashboard: What Metrics Actually Matter.