For months, I checked my Search Console numbers the same way most people do — logging in, clicking through the Performance report, squinting at the same three graphs, then closing the tab until next week. It worked, but it was slow, and it made it easy to miss the actual story hiding in the data.
Connecting Search Console to Looker Studio changed that. Instead of digging through Google’s native interface every time, I get one dashboard that shows exactly what I want to see, updated automatically. If you’ve read Google Search Console for beginners, you already know what impressions, clicks, and position actually mean. This is the next step — getting that same data into a format you can actually act on quickly.
What is Looker Studio, and why connect it to Search Console?
Looker Studio is Google’s free reporting tool. It pulls data from sources like Search Console, Google Ads, and Analytics, and turns it into charts and tables you can customize, filter, and revisit without rebuilding anything each time.
On its own, Search Console’s interface is functional but rigid — you’re stuck with Google’s default views and a 16-month data limit. Looker Studio doesn’t fix the 16-month limit, but it does let you build the exact report you actually check, save it, and come back to a live version any time instead of re-clicking through the same menus.
What do you need before connecting the two?
Just two things: a verified Search Console property, and a Google account with access to Looker Studio (the same Google login works for both).
If you haven’t set up Search Console yet, that’s a separate first step — Google Search Console for beginners walks through verifying your domain and submitting your sitemap. Come back here once that’s done and collecting data.
How do you connect Search Console to Looker Studio?
Step 1: Open Looker Studio and start a new report
Go to Looker Studio and sign in with the same Google account tied to your Search Console property. Click Create, then Report. This opens a blank report and immediately prompts you to add a data source.
Step 2: Choose the Search Console connector
In the data source picker, search for Search Console. Google’s own connector shows up as a native option — no third-party plugin needed. Click it.
Step 3: Select your property and data type
You’ll be asked to choose which verified Search Console property to pull from, and whether you want URL Impressions or Site Impressions as the data type. Site Impressions gives you the same domain-wide totals you see on Search Console’s overview page. URL Impressions breaks things down by individual page, which is more useful if you want to see performance post-by-post.
I use URL Impressions for most of my own reports, since domain-wide totals rarely tell me which specific pages need attention.
Step 4: Add the connection
Click Add in the top right, then confirm when Looker Studio asks if you want to add this data to the report. Your data should populate within a few seconds, showing up as a raw table by default.
Step 5: Build your first chart
From here, it’s normal Looker Studio work: click Add a chart, choose a chart type, and drag in the fields you want — Clicks, Impressions, CTR, Position, and Query or Landing Page as your dimension. A simple time-series chart of clicks and impressions over the last 90 days is usually the first thing worth building.
Step 6: Save and bookmark it
Once you’re happy with the layout, the report saves automatically to your Looker Studio account. Bookmark the URL or pin it somewhere you’ll actually see it — the whole point is replacing the habit of re-opening Search Console’s default interface every time.
Why bother, if Search Console already shows this data?
Because the native interface makes it hard to see a pattern at a glance, and hard to catch a real problem quickly.
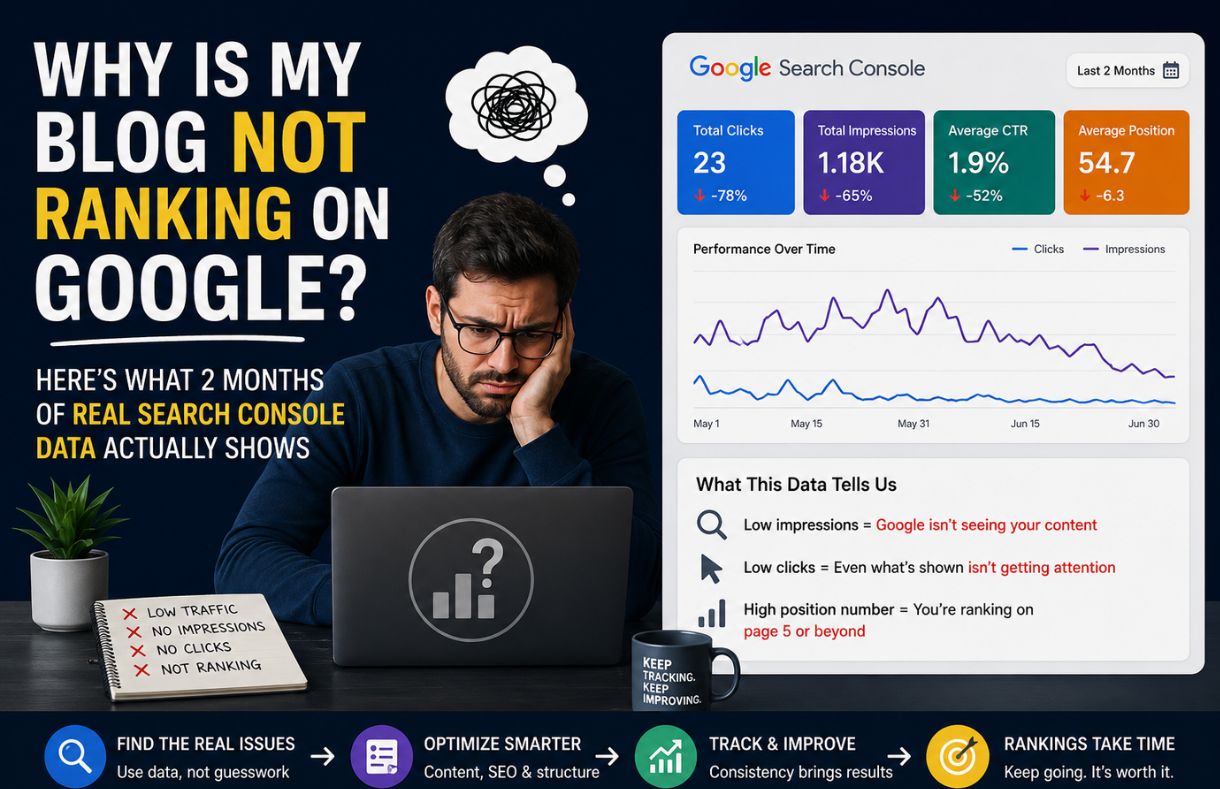
That’s the same gap I ran into while writing about why my own blog wasn’t ranking — impressions climbing steadily while clicks stayed flat, and the only way to actually see that mismatch clearly was sorting through the Performance report by hand, page by page. A Looker Studio dashboard with impressions and clicks plotted side by side would have shown me that gap in one glance instead of several sessions of digging.
If you’re seeing a similar pattern in your own data — impressions up, clicks flat — that’s usually a title or position problem, not an indexing one, and a dashboard makes it far easier to spot which pages are affected.
FAQ
Is Looker Studio free to use with Search Console?
Yes. Both the Search Console connector and Looker Studio itself are free. There’s no premium tier required for this connection.
Why does my Looker Studio data not match Search Console exactly?
Small discrepancies are normal, especially around anonymized or aggregated queries that Search Console doesn’t surface individually for privacy reasons. The overall trend should still match; exact totals sometimes won’t, down to a few percentage points.
Can I connect more than one Search Console property to the same report?
Yes. You can add multiple Search Console data sources to a single Looker Studio report, which is useful if you manage more than one site and want a combined or side-by-side view.
How far back does Search Console data go in Looker Studio?
The same 16-month limit that applies inside Search Console itself carries over — Looker Studio doesn’t extend it. If you want data older than that, you need to have been exporting or archiving it separately before the window closed.