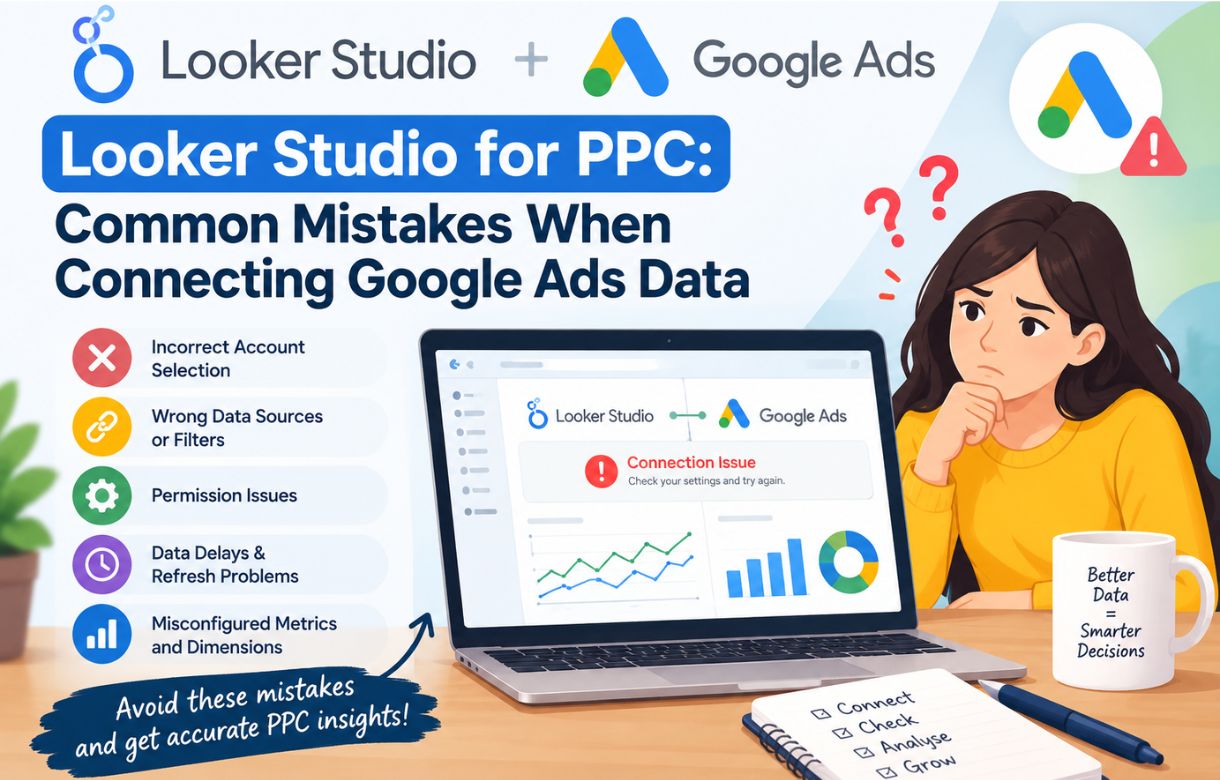
The frustrating thing about most Looker Studio mistakes with Google Ads data isn’t that the dashboard breaks obviously — it’s that it doesn’t. Charts render, numbers populate, everything looks fine on the surface, and the error only surfaces weeks later when a number doesn’t match what the client remembers, or what the native Google Ads interface shows for the same period.
After helping troubleshoot a handful of these setups — and making a few of these mistakes myself the first time I built a Google Ads dashboard in Looker Studio — here’s the list of what actually goes wrong most often, and how to catch each one.
Mistake 1: Connecting the wrong account level
If your Google Ads access sits under a Manager (MCC) account, Looker Studio’s connector will offer you both the MCC itself and the individual accounts beneath it. Selecting the MCC when you meant to connect one specific client account is the single most common first mistake — it either shows blended data across every account under that manager, or shows no usable data at all, depending on how the connector handles it.
The fix: Always select the specific sub-account unless you deliberately want a blended, agency-wide view. If numbers look dramatically larger or smaller than expected the moment you connect, this is the first thing to check.
Mistake 2: A frozen date range instead of a rolling one
Building a chart with a fixed date range — say, hardcoded to a specific month — works fine until that month is over, at which point the chart keeps showing stale data forever while you wonder why nothing’s updating. This mistake is especially costly if the dashboard is tied to a scheduled email delivery, since a client will keep receiving the same unchanging numbers every month without anyone noticing until someone actually reads the dates on the report.
The fix: Use Looker Studio’s relative date range options (“Last 30 days,” “Last calendar month”) rather than fixed start and end dates, unless you specifically need a one-time historical snapshot.
Mistake 3: Currency mismatches across accounts
If you manage client accounts in different currencies — or even the same currency displayed differently — blending multiple Google Ads accounts into one table without accounting for this can produce numbers that look plausible but are quietly wrong. A $500 spend from one account and a £500 spend from another don’t average or sum meaningfully without currency conversion, and Looker Studio won’t automatically flag this for you.
The fix: Check each connected account’s currency setting before blending data across accounts. If accounts use different currencies, either keep them in separate tables with currency clearly labeled, or use a calculated field to convert to a single reporting currency if a true blended total is genuinely needed.
Mistake 4: Mismatched date ranges across blended sources
When you blend two data sources in one table — say, Google Ads alongside a second Ads account, or Google Ads alongside GA4 — each source needs to be queried over the exact same date range for the comparison to mean anything. It’s easy to accidentally leave one source’s default range different from the other after making an edit, producing a table that silently compares, for example, this month’s Ads spend against last month’s conversion data.
The fix: After any edit to a blended data source, double-check that the date range control is actually applying uniformly across every source in the blend, not just the one you were editing.
Mistake 5: Conversion double-counting
Google Ads can report conversions in more than one way depending on how conversion actions are configured — some accounts count every conversion event, others count unique conversions per interaction, and the settings aren’t always obvious from inside Looker Studio’s field list alone. Pulling the wrong conversion metric, or combining two different conversion-counting methods across blended accounts, can make performance look better or worse than it actually is.
The fix: Confirm which conversion counting method each connected account uses directly in Google Ads’ own conversion settings before trusting a cross-account conversion comparison in Looker Studio. When in doubt, cross-check the Looker Studio conversion total against the same period’s number inside the native Google Ads interface — they should match exactly.
Mistake 6: Field mapping breaking after a template copy
If you’ve started from a free or paid template rather than building from scratch, swapping in your own data source sometimes leaves one or two fields unmapped, especially if the template was built against an older version of the connector or a slightly different account structure. The result is usually a single chart showing blank or zero values while everything else looks fine, which is easy to miss if you’re not checking every chart individually after the swap.
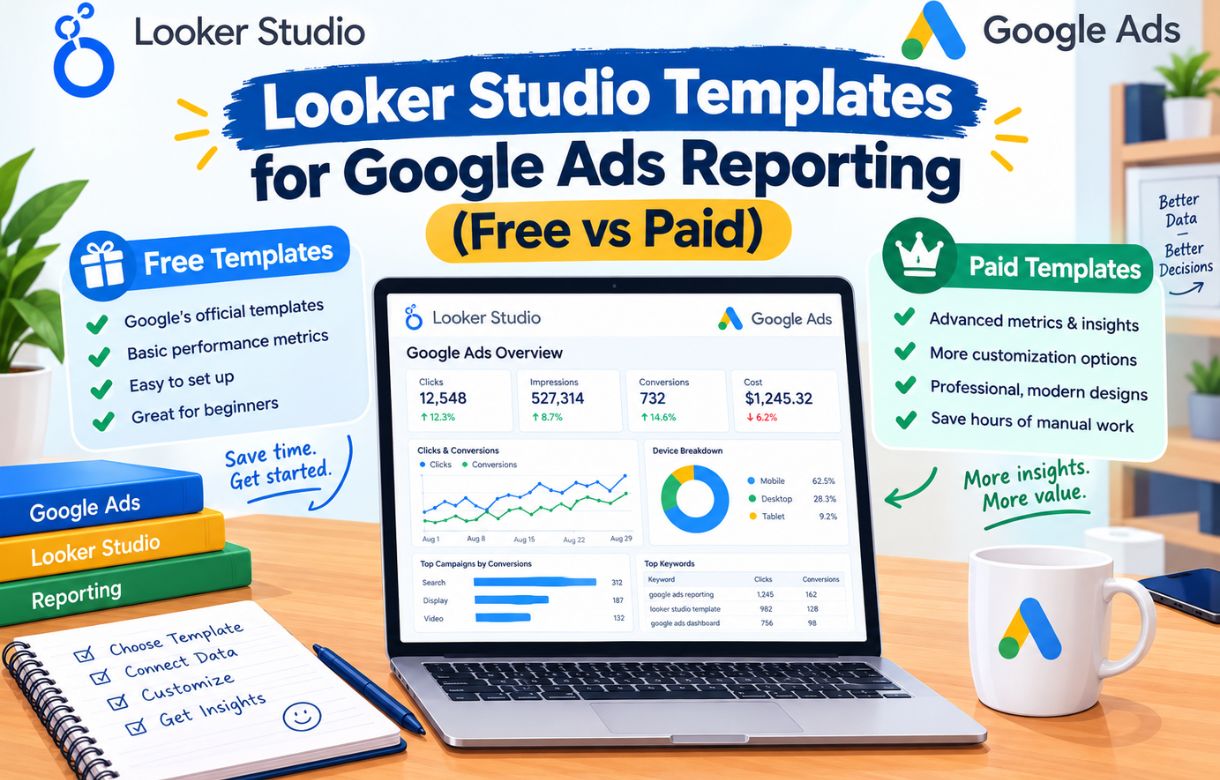
The fix: After connecting your own data to any template, click through every chart individually rather than just glancing at the overall layout. I covered what to look for specifically when evaluating a template in Looker Studio Templates for Google Ads Reporting (Free vs Paid), including this exact failure mode.
Mistake 7: Treating a scheduled report as “set and forget” permanently
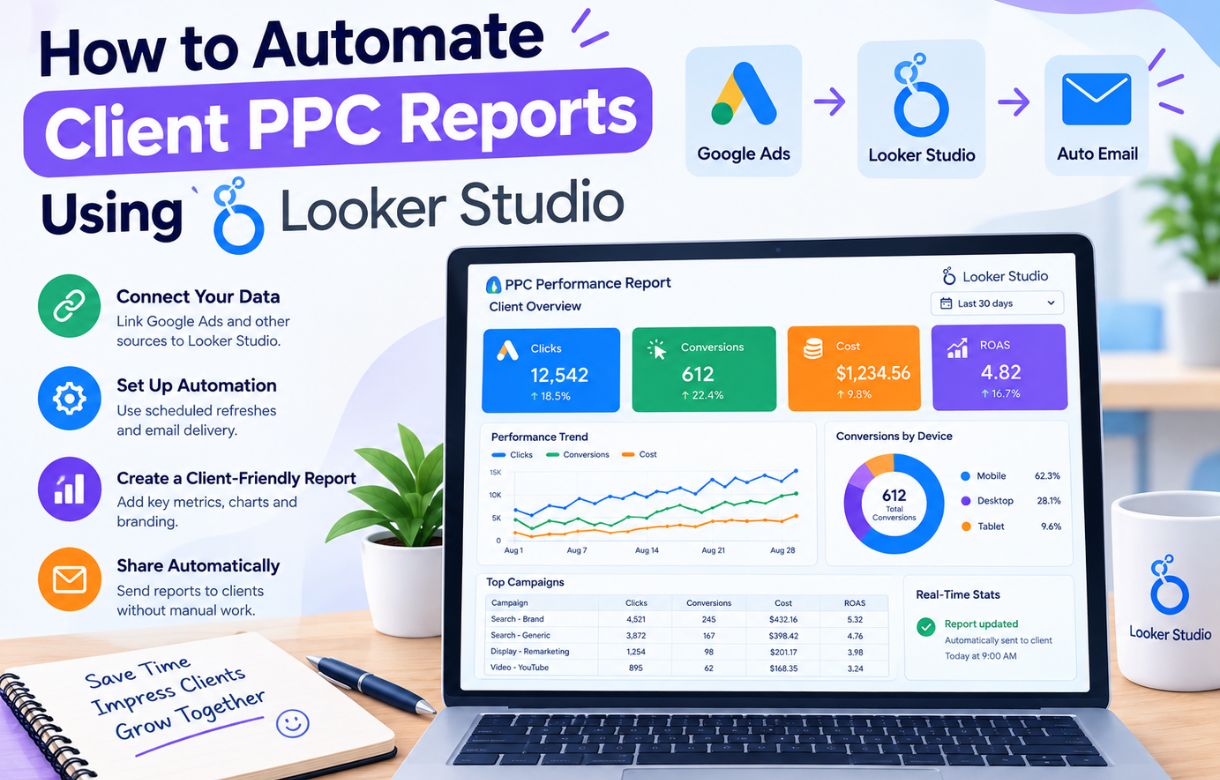
Even a correctly built automated report can drift out of accuracy over time — an account’s access permissions change, Google updates a field name, or a new campaign type gets added that the dashboard’s filters don’t account for. Setting up automated client PPC reports genuinely saves real time, but it isn’t a permanent fix-it-once solution; it still needs a periodic check-in.
The fix: Spot-check every automated report against the native Google Ads interface roughly once a quarter, not just at initial setup. This catches drift before a client does.
Mistake 8: Confusing “impressions” and “clicks” terminology across platforms
If you’re used to Search Console’s definitions of impressions and clicks from SEO reporting, it’s worth knowing Google Ads’ definitions aren’t identical in every edge case — particularly around how certain ad formats or placements count an impression. This rarely causes a major reporting error on its own, but it can cause confusion when explaining numbers to a client who’s seen similar-sounding terms used slightly differently elsewhere.
The fix: When in doubt about an exact definition, check Google Ads’ own help documentation for that specific metric rather than assuming it behaves identically to the same-named metric in a different Google product.
How do you catch these mistakes before a client does?
The single most useful habit is a basic sanity check: before trusting any new dashboard or blended view, cross-reference the top-line numbers — total spend, total clicks, total conversions — against the native Google Ads interface for the exact same date range and account. If they match, the underlying connection is almost certainly sound. If they don’t, you’ve caught a problem at the setup stage instead of after a client has already seen an inaccurate report.
It’s also worth building this check into your actual workflow rather than treating it as a one-time setup step. A quick spot-check each time you add a new client account, swap a template, or make a structural change to a blended report takes a few minutes and catches the overwhelming majority of the mistakes on this list before they ever reach a client’s inbox.
Is this list different for a single-account setup versus an agency managing several?
Several of these mistakes — the frozen date range, the field mapping break after a template copy, confusing terminology across platforms — apply just as easily to a single account as to an agency setup. The currency mismatch, blended date range misalignment, and the wrong-account-level selection are specifically multi-account problems, so a solo blogger managing one Google Ads account for their own site can skip worrying about those three. If you’re only running one account, the shorter practical checklist is: use a rolling date range, verify conversion counting matches the native interface, and double-check every chart individually after copying any template.
FAQ:
How do I know if my Google Ads conversion numbers in Looker Studio are accurate?
How do I know if my Google Ads conversion numbers in Looker Studio are accurate?
Compare the exact same date range and conversion metric directly in Google Ads’ native interface. If the two don’t match, something in the connection, field mapping, or conversion counting method needs investigating before you trust the Looker Studio figure.
Can a currency mismatch happen even within a single Google Ads account?
Not within a single account — an individual Google Ads account has one consistent currency setting. This mistake specifically arises when blending data across multiple accounts that may be set to different currencies.
Is it normal for Looker Studio data to lag slightly behind the Google Ads interface?
Yes, within a few hours, which is normal for most connector-based reporting tools. If the discrepancy is larger than that, or persists for more than a day, it’s more likely a connection or configuration issue than a simple reporting lag.
Should I rebuild a dashboard from scratch if I find one of these mistakes in an existing report?
Not usually. Most of these issues can be fixed by correcting the specific setting at fault — a date range, a field mapping, an account-level selection — rather than starting over. Rebuilding from scratch is rarely necessary once you’ve identified exactly where the problem is coming from.